Draw Conditional Multivariate Normals
rmvnorm.cond.RdFast way to draw conditional multivariate normals when the covariance matrix is sparse.
Arguments
- n
number of observations.
- y
observed vector.
- mu
mean vector.
- SigmaXX
covariance of X, required (of class
spam).- SigmaXY
cross-covariance of X-Y, optional (of class
spam).- SigmaYY
covariance of Y, required (of class
spam).- noise
observational noice of Y, optional. See ‘Details’.
- RstructYY
the Cholesky structure of
SigmaYY.- ...
arguments passed to
chol.
Details
Quite often, we want to draw condional observations \(X|y\)
from the model \(Y=X+e\), where \(X\) has covariance matrix
SigmaXX and \(e\) has white noise.
Covariance of \(Y\) can be specified by SigmaYY or
SigmaXX+diag(noise,). If \(Y\) and \(X\) do not have the
same dimensions, SigmaXY needs to be specified.
The function also implmements a general multivariate model, where the we only observe part of the vector. The components are first \(X\) then \(Y\).
The function rmvnorm.cond() is a wrapper to
rmvnorm.conditional() and included to increase similarities
with other packages.
See also
Examples
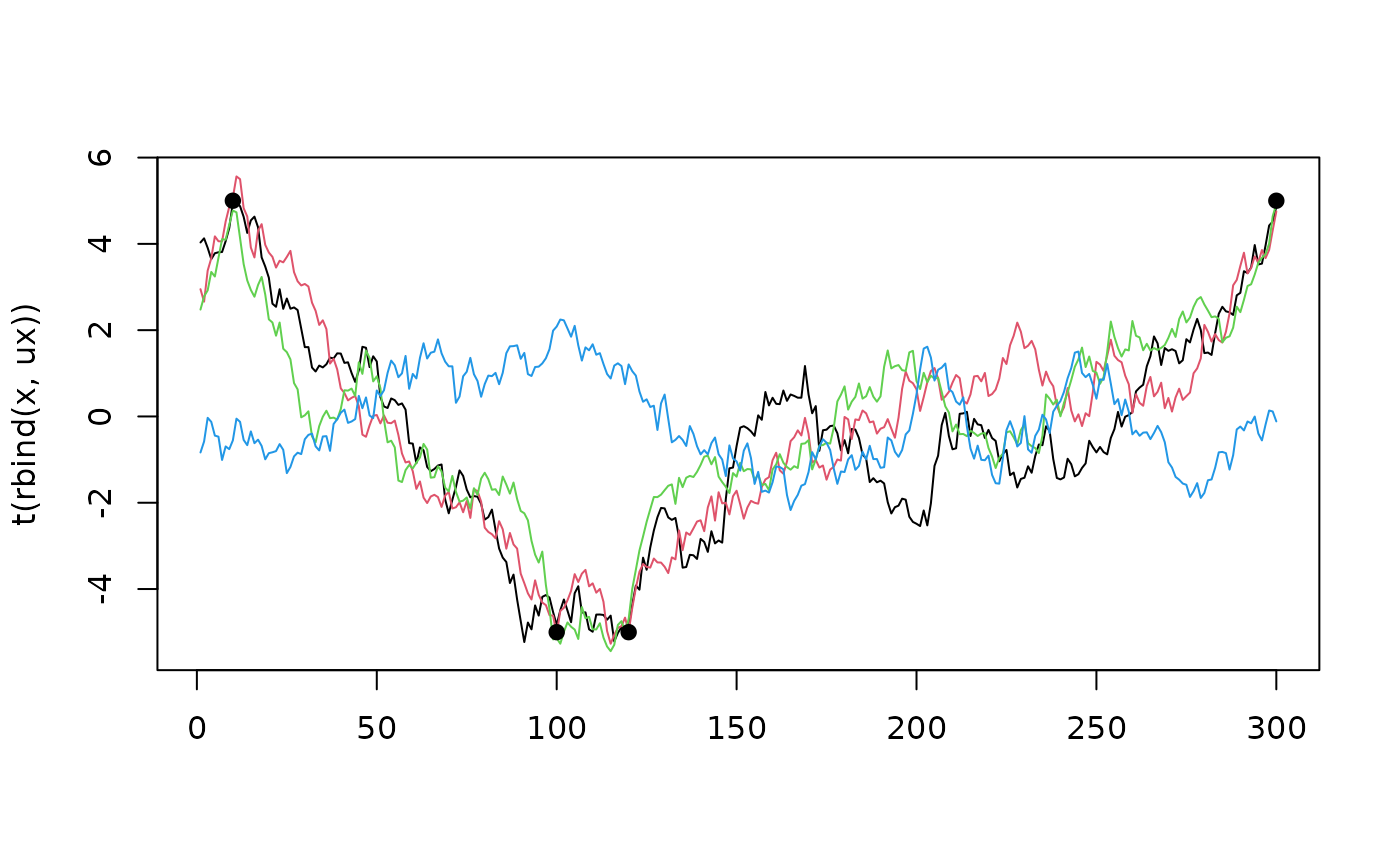
set.seed(12)
N <- 300
y <- c(5, -5, -5, 5)
SigmaXX <- as.spam(.95^abs(outer(1:N, 1:N, "-")), eps=1e-4)
sel <- c(10, 100, 120, 300)        # where we observe y
SigmaXY <- SigmaXX[, sel]
SigmaYY <- SigmaXX[sel,sel] + diag.spam(.01, length(y)) # some noise
x <- rmvnorm.conditional(3, y, SigmaXX=SigmaXX, SigmaXY=SigmaXY,
                         SigmaYY=SigmaYY)
# unconditional sample:
ux <- rmvnorm(1, Sigma=SigmaXX)
matplot(t(rbind(x, ux)), type='l', lty=1)
points(sel, y, pch=19)