Display a Sparse Matrix as Color Image
image.RdThe function creates a grid of colored rectangles with
colors corresponding to the values of the spam matrix.
# S4 method for spam
image(x, cex = NULL, ...)
Arguments
- x
matrix of class
spamorspam.chol.NgPeyton.- cex
for very large matrices, the dot size may need to be scaled.
- ...
any other arguments passed to
image.defaultandplot.
Details
getOption("spam.imagesize") determines if the sparse matrix is
coerced into a matrix and the plotted similarly to image.default or if
the matrix is simply represented as a scatterplot with
pch=".". The points are scaled according to
cex*getOption("spam.cex")/(nrow+ncol).
For some devices or for non-square matrices,
cex needs probably some adjustment.
The a zero matrix in spam format has as (1,1) entry the value
zero and only missing entries are interpreted as NA in the
scatter plot.
See also
display and spam.options.
The code is based on image of graphics.
Examples
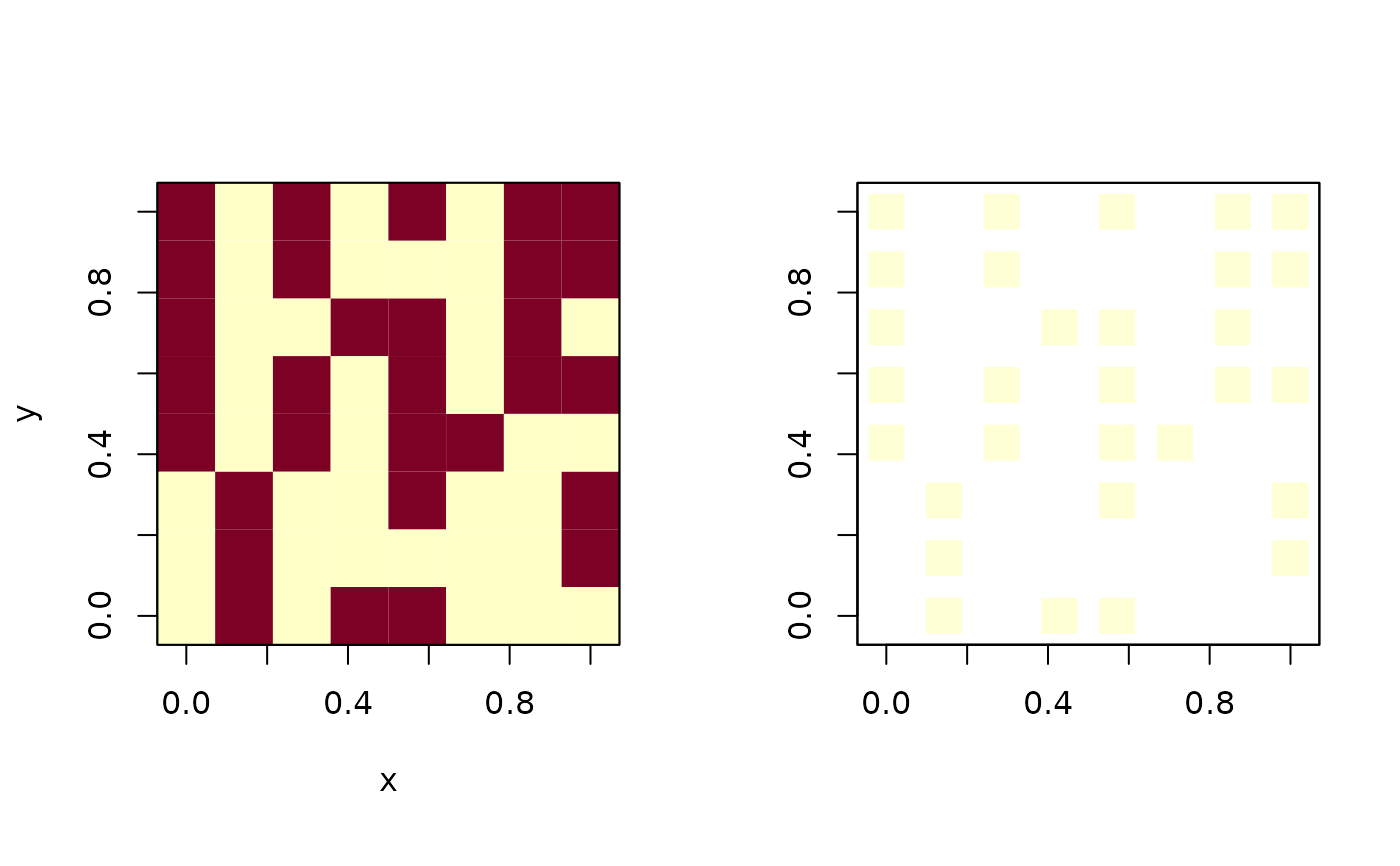
set.seed(13)
smat <- spam_random(8)
par(mfcol=c(1,2),pty='s')
options(spam.imagesize=1000)
image(smat) # or use better color schemes
options(spam.imagesize=10)
image(smat, cex=.25)
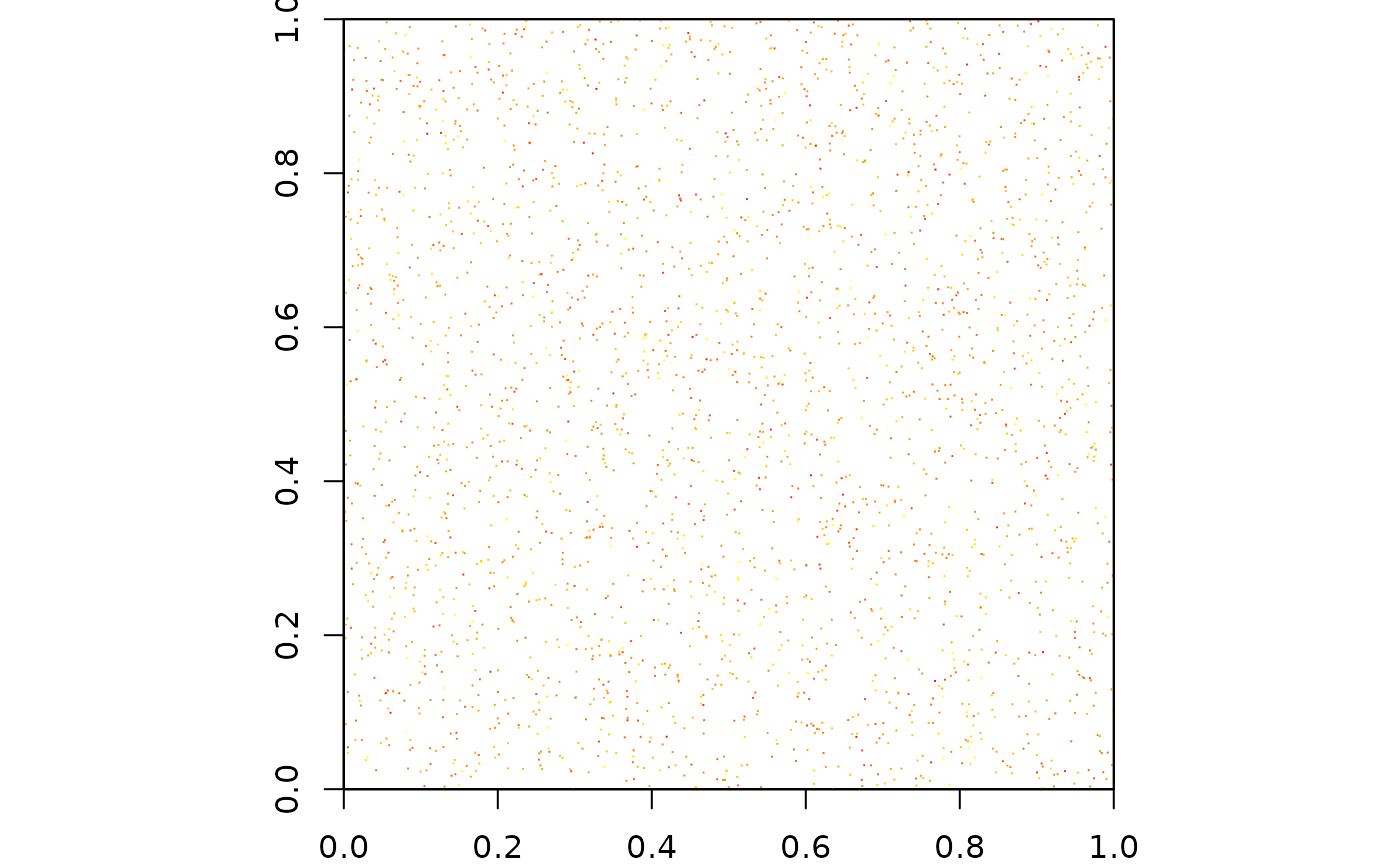
 smat <- spam_random(2^14, distribution=rnorm, density=1e-5, verbose=TRUE)
#> Density is 0.0000104, specified is 0.00001 (nnz=2798).
par(mfcol=c(1,1), mai=c(.4,.4,.1,.1), pty='s')
image(smat)
smat <- spam_random(2^14, distribution=rnorm, density=1e-5, verbose=TRUE)
#> Density is 0.0000104, specified is 0.00001 (nnz=2798).
par(mfcol=c(1,1), mai=c(.4,.4,.1,.1), pty='s')
image(smat)