
Research
The range of research topics of the Applied Statistics group is broad. A few typical projects are listed here. Selected published work is available via ZORA.
For possible and future Master's thesis in Mathematics or in Biostatistics, see here. We often have shorter projects as well, see here.
See also our Declaration of Reproducibility Policy.
Interpretable decision support model estimation for intracranial aneurysms
Matteo Delucchi, in collaboration with ZHAW
A better understanding of the interplay of intracranial aneurysms (IAs) rupture risk factors can be highly beneficial in making clinical decisions about the treatment of unruptured IAs. IAs are bulges in cerebral arteries present in about 3% of the population. While most of these IAs are asymptomatic, sudden rupture can lead to a type of hemorrhagic stroke, which often has poor functional outcomes. Clinicians base their treatment decisions on a combination of expertise, guidelines, and risk prediction scores. However, weighing treatment risks and benefits remains inherently difficult due to unknown disease mechanisms and interdependent rupture risk factors.
This project aims to create a more accurate and practical clinical decision support system by developing a probabilistic graphical model that accounts for the interdependence among rupture risk factors and incorporates clinical expertise. When it comes to analyzing complex and highly dimensional datasets, additive Bayesian network modelling (R package abn) is a powerful machine-learning approach that can help identify associations. Moreover, it allows for the flexible modelling of continuous and discrete variables of various distribution types and multiple data sources.
We could show, on a single-centre data set, that BNs facilitate knowledge discovery of the IA disease compared to standard statistical analyses. For example, only a few factors are directly associated with IA rupture. To improve the generalisability, we collect a new, multicentre data set of IA rupture risk factors and expand the R package abn to account for more complex data generation processes.

Publication:
A Consistent Hierarchy of Models for Exploratory Experimental Research

Servan Grüninger
Experimental design and analysis necessitates the combination of scientific and mathematical models in a consistent fashion. Every experiment usually begins with a hypothesis about the world, stated in quite general terms and of broad scope: the Primary Model. To inquire about the hypothesis scientifically, it has to be transformed into a hypothesis which is empirically testable with current methods and resources: the Experimental Model. Hence, a suitable experimental context with clearly defined parameters and outcomes must be specified. Both levels are usually stated in the scientific language of the discipline in which the experiment takes place and only the next two levels are in the realm of statistics. First, the data generation process must be described by a Data Model, followed by the specification of the experimental process in the form of the Experimental Design Model which is then combined with a particular Data Analysis Model for analysis. that specifies the statistical measures and tests that are used to analyze the data.
The goal of this thesis is to provide a consistent hierarchical framework relating the inferential paths from a Primary Model about the world to the data gathered and back to the Primary Model in exploratory experiments. The value of such a framework consists in helping expose and prevent logical and mathematical inferential challenges and also aid the consistent and meaningful planning of experiments, which is demonstrated in three use cases.
Novel Machine Learning Algorithms for Large Spatial Data
Tim Gyger, in collaboration with HSLU
The Gaussian Process regression model, provides a flexible method of interpolation by identifying the underlying spatial structure in the data, commonly referred to as Kriging. A recent proposal in advocates the incorporation of tree-boosting algorithms to model the fixed effects in the regression model. This approach has the advantage that complex functions in the predictor variables can be learned. The model parameters are typically estimated through the repetitive calculation of the negative log marginal likelihood and its derivative with respect to the hyperparameters. However, this calculation becomes computationally unfeasible for large datasets.
To address this issue, we propose a novel approach that enables scaling to larger datasets through the utilization of a full-scale covariance approximation (FSA) combined with conjugate gradient algorithms for the linear solves and stochastic trace estimations for the log-determinant and its derivative.
Through first simulations, we evaluated that a simple preconditioner given by the structure of FSA has a highly positive impact on the convergence of the conjugate gradient method and the variance reduction in trace estimations. This leads to improvements in runtime and accuracy of the log-likelihood estimates. Moreover, we investigate a novel approach for a low-rank covariance approximation based on variants of the Lanczos Algorithm. Furthermore, we will apply our model to a real-world dataset describing specific structural characteristics of the Laegeren mountain. We will evaluate the predictive accuracy of our approach and compare it with state-of-the-art methods.
Pruning Sparse Dataframes of Linguistic Data
Marc Lischka, in collaboration with Anna Graff and other NCCR EvolvingLanguage members
With increasing availability of linguistic data in large-scale databases, the perspective of appropriately merging data from such databases via language identifiers (such as glottocodes) and performing large-scale analyses on such aggregated datasets becomes attractive, especially for analyses that aim at testing hypotheses at global scales, for which data collection may not be feasible for large numbers of variables.
Some of these databases have near-complete variable coding density for all languages present (e.g. PHOIBLE, Grambank), others’ variables are coded for very different sets of languages (e.g. AUTOTYP, Lexibank, WALS), resulting in sparse variable-language matrices. Additionally, combining data from various databases results in further sparsity. Our initial dataset including original variables, modified variables and merged variables has an overall coding density of ~15%. It is clear that many languages and variables in such an initial dataset have such low coding densities that including them in analysis is not sufficiently beneficial, e. g. due to their contribution to extra computational time.
We develop an iterative procedure to prune the aggregated matrix, following criteria set with the aim to optimise the language-variable matrix in terms of coding density and taxonomic diversity, primarily. The criteria we employ relate to a) the taxonomic importance of each language given the current language sample (we could call this a “vertical” criterion) and b) weighted density of data for both languages and variables (criterion both “vertical” and “horizontal”). Point (a) means we want to make the removal of a language representative of a family that is present with few languages in the current sample more expensive than the removal of a language from a family that is present in the matrix with many languages.
In addition to the raw coding densities of languages and variables, we want to base our decision as to which of them to prune in a given step on weighted densities. It makes sense to keep languages that are coded for variables of high density and, vice versa, to keep variables coded for languages of high density. Hence, weighted language densities are computed using the variable densities as weights and vice versa. This approach can be iterated.
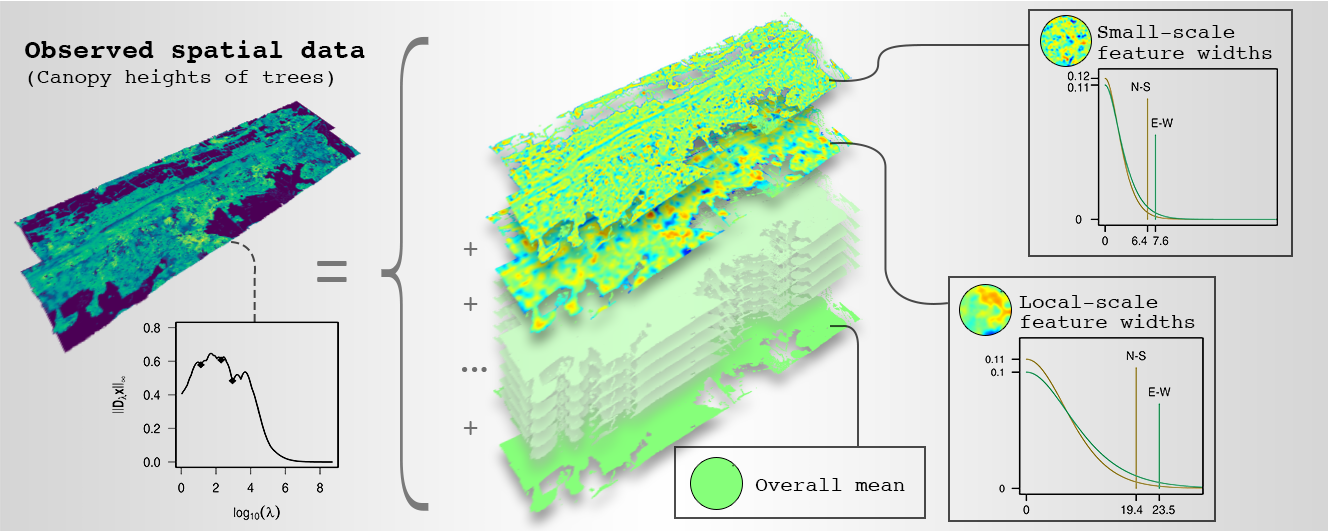
Identification of Dominant Features in Spatial Data
Roman Flury
Dominant features of spatial data are connected structures or patterns that emerge from location-based variation and manifest at specific scales or resolutions. To identify dominant features, we propose a sequential application of multiresolution decomposition and variogram function estimation. Multiresolution decomposition separates data into additive components, and in this way, enables the recognition of their dominant features. The data are separated into their components by smoothing on different scales, such that larger scales have longer spatial correlation ranges. Variogram functions are estimated for each component to determine its effective range, assessing the width-extent of the dominant feature. Finally, Bayesian analysis enables the inference of identified dominant features and to judge whether these are credibly different. The efficient implementation of the method relies mainly on a sparse-matrix data structure and algorithms. In disciplines that use spatial data, this method can lead to new insights, as we exemplify by identifying the dominant features in a forest dataset. In that application, the width-extents of the dominant features have an ecological interpretation, namely the species interaction range, and their estimates support the derivation of ecosystem properties such as biodiversity indices.
Publication: https://doi.org/10.1016/j.spasta.2020.100483
Supplementary material https://git.math.uzh.ch/roflur/spatialfeatureidentification.
Unveiling the tapering approach
Federico Blasi as well as Roman Flury and Michael Hediger
Over the last twenty years, whopping increases in data sizes for multivariate spatial and spatio-temporal data has been recorded and simulated (i.e. remotely sensed data, bathymetric data, weather, and climate simulations, inter alia), introducing a new exciting era of data analysis, yet unveiling computational limitations of the classical statistical procedures. As an example, the maximum likelihood estimation involves solving linear systems based on the covariance matrix, requiring O(n3) operations, which can be a prohibitive task when dealing with very large datasets.
A vast variety of strategies has been introduced to overcome this, (i) through "simpler" models (e.g., low-rank models, composite likelihood methods, predictive process models), and (ii) model approximations (e.g., with Gaussian Markov random fields, compactly supported covariance function). In many cases the literature about practical recommendations is sparse.
In this project, we fill that gap for the tapering approach. Along with a concise review of the subject, we provide an extensive simulated study introducing and contrasting available implementations for the tapering approach and classical implementations, that along with good statistical practices, provides an extensive well-covered summary of the approach.

Software:
- R package spam:
https://cran.r-project.org/web/packages/spam - R package spam64:
https://cran.r-project.org/web/packages/spam64
(Click on image to enlarge).